
We’ve looked at how visual representations of data can help you to build your financial literacy (if you missed it you can read it here).
This time we’re looking a bit deeper at the same base data to see what else we can find, and how you can make strategic decisions for your business.
For many businesses, the two major costs they experience are
- Cost of Sales – that is the inputs that they have to spend to produce each product or service that they sell
- Wages
Understanding how each of these main costs impact your business means that you can make better decisions to move your business to the next level.
Lets start with Gross Profit %
This is the % of every sale that you have left after you’ve paid any direct costs or ‘cost of sales’.
In the graph below, we’ve plotted the Gross Profit % (Gross Profit $ / Total Income), we’ve also included a target band, in this case 35%.

This makes it very easy to see which months were within our target and which months were under. You’ll remember from our previous article that in this case-study, the business’ main cost of sale was direct wages that don’t fluctuate very much. So what happens if we add ‘revenue’ on the graph?
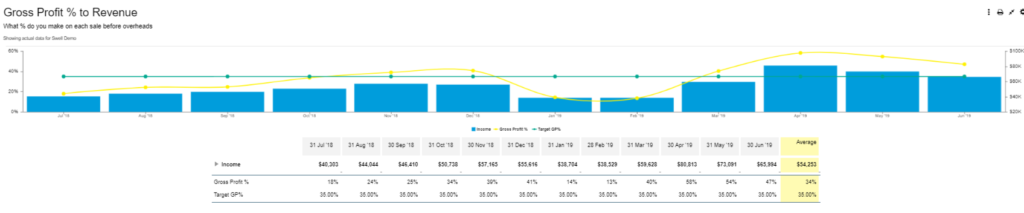
Now you can see that the months that have low Gross Profit % also have low revenue, this business cannot do a lot to change it’s costs, so to improve performance it needs to focus on revenue, specifically within the months of January, February, July, August and September.
What about wages?
Payroll is often another big cost center for businesses. We typically look at this as a percentage of sales, that is ‘for every $1 of sales, how much goes to paying wages?’
Again we’ve plotted total wages (including direct wages) against sales to get a % (Total Wages / Total Sales). The business has also set a target of 60% – meaning for every $100 in sales they don’t want wages to cost anymore than $60, leaving $40 to cover overheads and profit.

By using visual data, it is very easy to see that this business is operating outside of it’s target. The average number tells us that wages costs are currently 72.66% of sales, so they need to reduce wages by 13%. Wages can often be difficult to reduce where staff are permanent so again there are limited actions that the business can take. They could retrench some staff, however this might lead to reduced service standards, so what else can they do?
The answer is again to increase sales – if we add total sales to the graph, you can clearly see that months that the wages % goes over budget are the same months that sales are low.
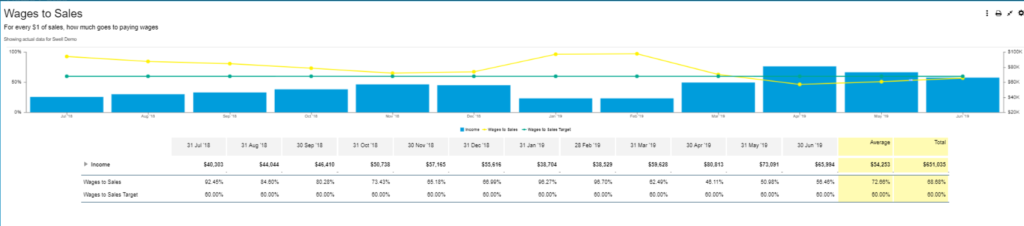
So for this business the clear strategy is to improve revenue – next we explore how to use data to make the decision on how best to do this.
Want help deciphering your business data – our Cash Flow Forecasting Program, Swell is built for you. Check it out and book a complimentary consultation to discover how we can help make business sense simple.